Through survey lasted 100 days, BFZH Enterprise management & consultation Co. Ltd. performed a random interview for more than 13,000 15-74 year-old Beijing residents. Among those, there are 8377 people interviewed successfully and 8838 people’s single-day shopping expenditure was recorded. Interviewees’ expenditure behaviors relate to shopping centers, department stores, hypermarkets, supermarkets and convenience stores, discount stores, specialty stores, exclusive shops, street vegetable markets and other retail formats, as well as Chinese catering enterprises, Chinese fast-food enterprises, Western catering enterprises, Western fast-food enterprises and other catering enterprises.
According to the original design, shoppers’ expenditures collected in this project are not including the following expenditures of shoppers temporarily: vehicles and spare parts including automobile, fuel including fuel gas and fuel oil, medical and hospitalization expenses, books , newspapers and magazines, transportation and communication expenses, housing and building materials.
Residents purchase rate and Single purchase amount
In 2013, among more than 20 million resident population in Beijing, there are 3.455 million people shopping in physical stores, 0.91 million people shopping online, 1.623 million people eating out. Consumers account for 20.1%、7.9% and 5.3% of 15-74 year-old Beijing population respectively. Shoppers average expenditures transaction sorted in descending order are as follows: online shopping at the amount of 336 yuan, physical stores at the amount of 161yuan and eating out at the amount of 84yuan. Online shopper’s average expenditure transaction is much higher than average transaction amount of physical stores and eating out.

Shoppers’Demographic characteristics
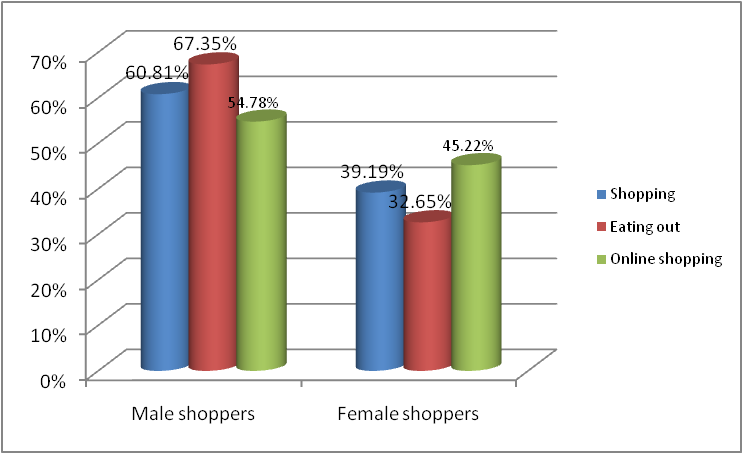
Gender characteristics: Number, amount of consumption and average expenditure transaction of male customers shopping in physical stores and eating out are higher than those of female customers. Female online shoppers outnumber male online shoppers. But amount of consumption and average expenditure transaction of male online shoppers are both higher than those of female online shoppers.
Expenditures proportion of customers of different genders
Age characteristics:
Among customers shopping in physical stores, eating out and shopping online, consumers eating out and shopping online are relatively young and consumers of all ages will consume through physical retail channels.
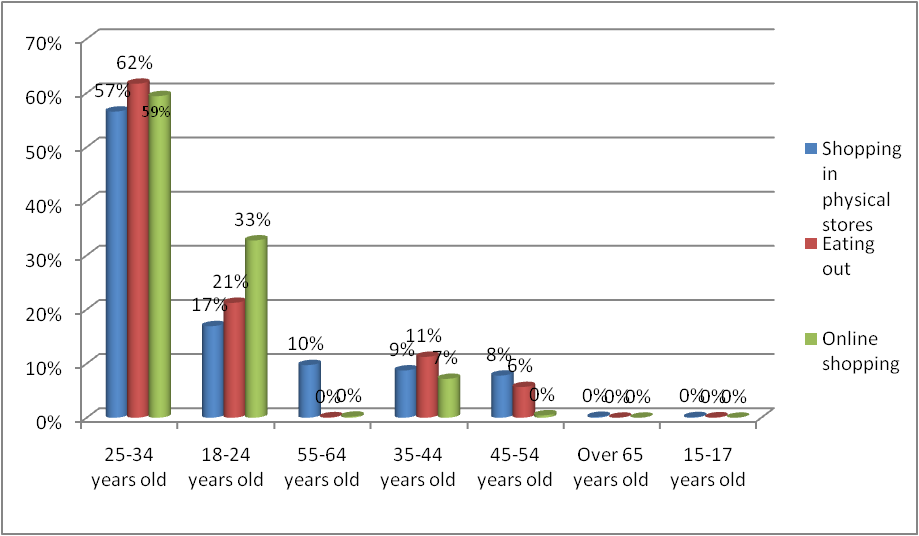
Shoppers with highest average expenditure per transaction in physical stores are those in the 55-64、45-54 and 25-34 age ranges. Customers eating out with the highest average expenditure per transaction are those in the 45-54, 35-44 and 18-24 age ranges. Online shoppers with the highest expenditure per transaction are those in the 35-44、25-34 and 45-54 age ranges. 45-54 and 55-64 aged consumers’ average expenditure per transactions spent in physical stores and eating out are the highest, and their average online shopping expenditure per transactions is lower than the relatively young customers’ .
Regional Characteristics
Core Districts of Capital Function’s customers number of shopping, eating out and shopping online reach the highest proportion of Beijing’s customers, followed by New Districts of Urban Development, Ecological Preservation Development Districts and Urban Function Extended Districts. Urban Function Extended Districts and New Districts of Urban Development’s customers number’s proportion of shopping, eating out and doing online shopping reach about 85%, accounting for the vast majority of the consumers.
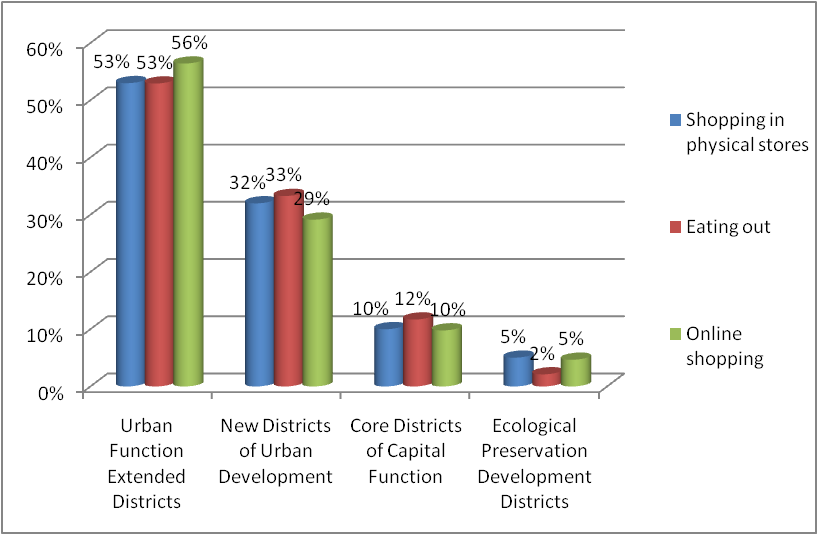
In terms of the expenditure on shopping in Physical stores, Urban Function Extended District has the highest proportion of it, followed by New Districts of Urban Development, Core Districts of Capital Function and Ecological Preservation Development Districts.The proportion of the expenditure on shopping and eating out of Urban Function Extended Districts accounts for 28% and 20%, which are higher than those of New Districts of Urban development.The proportion of the expenditure on online shopping of these two districts are 45% and 40% respectively, which are very close.
Areas with average expenditure per transaction sorted in descending order are as follows: Urban Function Extended Districts, Ecological Preservation Development Districts, New Districts of Urban Development and Core Districts of Capital Function. The sequences of areas sorted by average expenditures per transaction of eating out and online shopping are very different form it.
New Districts of Urban Development’s costumers average expenditure per transaction of eating out is the highest one, amounting to 144 yuan. Core Districts of Capital Function’s costumers average expenditure per transaction of online shopping is the highest one, amounting to 595 yuan.
Occupational characteristics
The person in charge has the hightest average expenditure per transaction in physical stores, amounting to 486 yuan, in addition, followed by production and operation personnel and military men, professional technical personnel, business and services personnel and clerks. Costumers with average expenditure per transaction of eating out sorted in descending order are as follows:person in charge, Business and services personnel, production and operation personnel and military men, clerks and other personnel. Costumers with average expenditure per transaction of online shopping sorted in descending order are as follows: professional technical personnel, business and services personnel and other personnel.
average expenditure per transaction of customers with different occupations
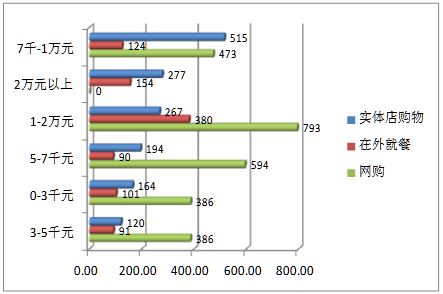
Income Characteristics: Shopping frequency differences of shoppers at different income levels in physical stores is not obvious. The differences in eating out and online shopping are obvious.
Average expenditure per transaction of shoppers at different income levels:
Market performance of various formats of retail market
market shares of major formats’
In the formats of 2013 Beijing retail market , shopping centers and department stores has the highest market share amounting to 36%, followed by Hypermarket, 28%, the supermarkets and convenience stores, 14%. The market shares totaled up to 78%. These formats are the main channels for Beijing city residents daily shopping.
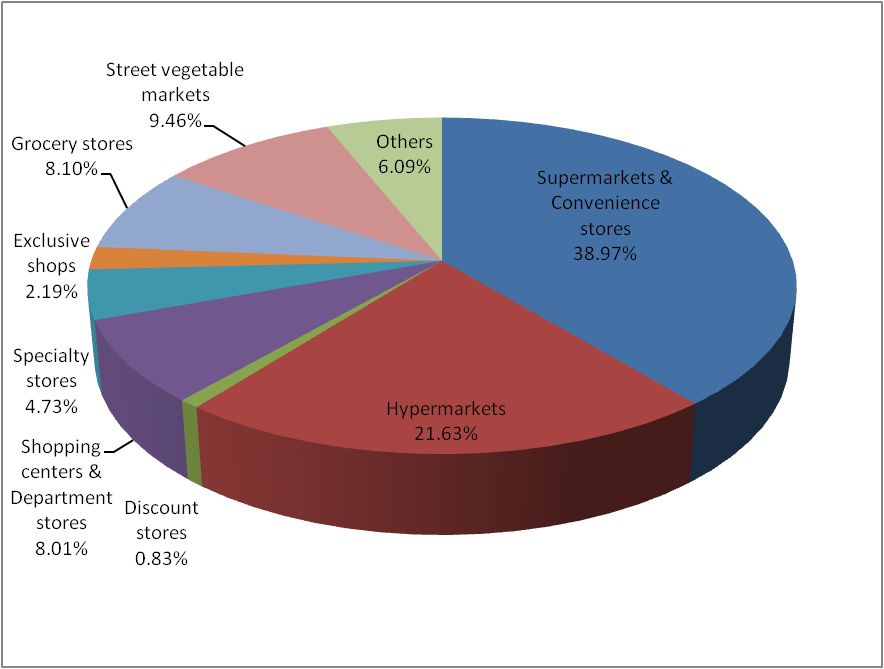
Shoppers number in major retail formats
The number of shoppers sorted in descending order are as follows: convenience stores and supermarkets 39%, hypermarkets 22%, street vegetable markets 9%, grocery stores 8%, shopping centers and department stores 8%, others 6%, specialty stores 5%, Exclusive shops 2% and discount stores 1%. Customers in convenience stores, supermarkets and hypermarkets account for the greatest number of customers, achieving 61%. Holding a low proportion, customers in shopping centers and department stores achieves 8%, which is lower than the number of customers in street vegetable markets and grocery stores.
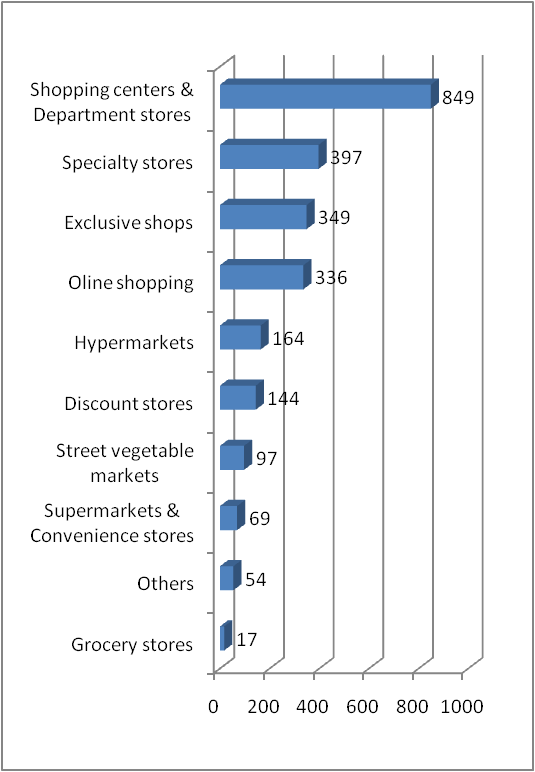
Average expenditure per transaction of major Retail formats
Shopping centers and department stores have the highest average expenditure per transaction of retail formats, reaching 849 Yuan, followed by specialty stores, Exclusive shops, online shopping and hypermarkets whose average transaction amounts was 397 yuan, 349 yuan, 336 yuan and 164 yuan. Convenience stores and supermarkets’ average expenditure per transaction is relatively low at 69 Yuan.